Digital marketing has one extreme advantage over old media – everything is trackable! By tracking your app metrics, you can have a better understanding of how your marketing campaigns are performing, how your app interacts with users and where your revenue is coming from. Defining a set of app KPIs and constantly analyzing the data allows you to make informed decisions that will improve your app and overall business. In order to have a better understanding of how your app is evolving, we’ll split the metrics into 2:
- App engagement metrics
- App performance metrics
App engagement Metrics
App engagement metrics showcase how users interact with mobile apps. How much time they’re spending using the app and how many times a day? How fast users uninstall an app or what their life expectancy is within the app? By knowing and defining these metrics, you can analyze them through a mobile app metrics dashboard and increase user engagement through app tweaks (make game levels easier, improve UX, better communicate with users).
Active users (ADAU, MAU)
One of the first and most important app metrics to take into consideration is the one related to Active users. The Active users metric shows the health of an app and how it evolves over time. If this metric rises, you know that your app is growing. It’s that simple. Active users can be defined using 4 sub metrics:
- Daily Active Users (DAU): Total number of users who interact with the app on a specific day
- Average Daily Active Users (ADAU): Total number of active users in a month / the number of days in that month
- Weekly Active Users (WAU): Total number of users who interact with the app in a period of 5 to 7 days (depending if weekends are taken into account or not)
- Monthly Active Users (MAU): Total number of users who interact with the app over a period of 30 days
ADAU and DAU are often misused. If you’re stating that you had 4,000 Active users per day in January, you are not stating a DAU, but the ADAU. You are only stating the DAU if you say: “We had 4,000 Active users in January on the 21st of the month.” Depending on the type of app you are managing, you may need to pick 1 or more of the above to measure. A game would look at the ADAU, as it can be played daily, while a food delivery app may spend more time looking into MAU. 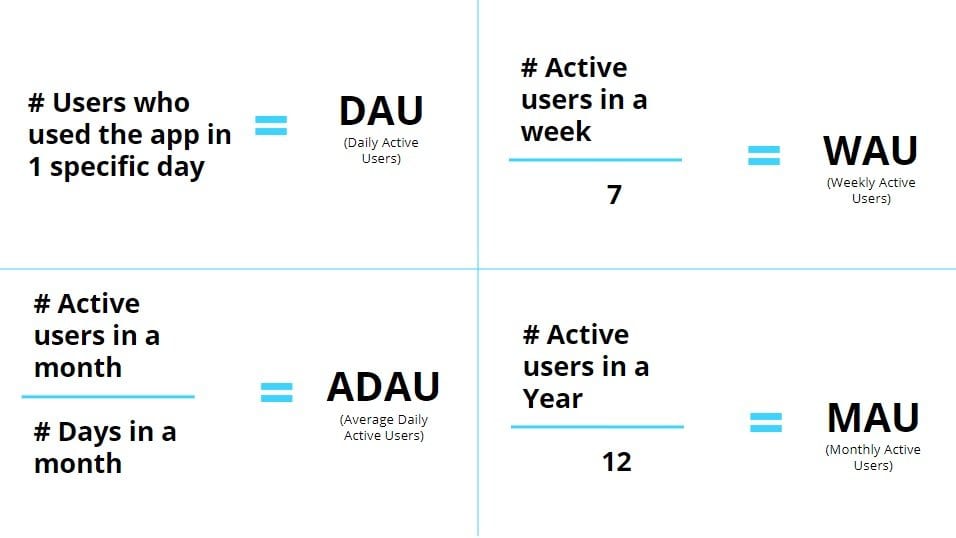
Stickiness
Stickiness is a sign of long term app growth. It can be calculated by dividing the ADAU by the MAU. The resulting percentage is the approximate stickiness of the app. Having a sticky app can help in 2 ways:
- With long term marketing projections. By knowing how many users will stay in the app based on the data, budgets can be planned accordingly and forecasts can be more precise.
- Having a sticky app can be a trust factor in pitching your app for further investments. It shows that an app is already loved by users and that, by improving the app, it can still grow and deliver results.
App Session interval
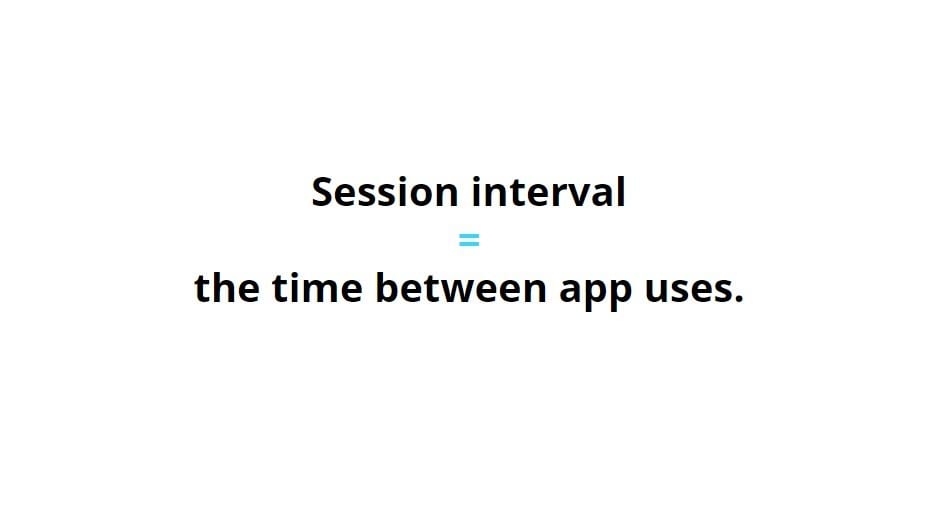
An App’s Session interval is a mobile app analytics metric. It delivers data on how users interact with the app and the amount of time between uses. For example, an e-book app may be used more frequently in the morning, during the commuting hours and less over the weekends. Or a food delivery app may be used more during lunch or dinner times rather than between meals. By knowing this metric, app developers can work on improving the app, including new functionalities and delivering a better experience to the user. Session interval = the time between app uses.
Session length
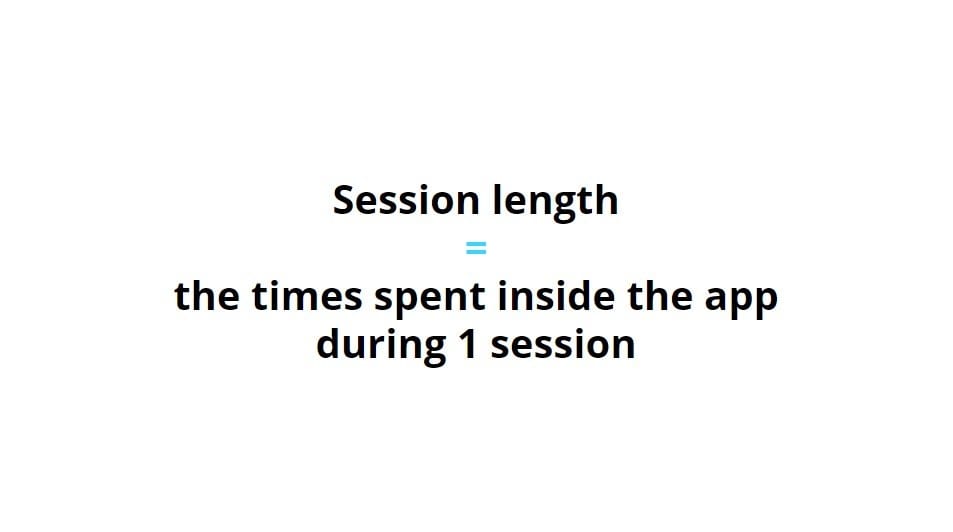
Session length delivers information about how much time people spend inside of the app during 1 session. Most of the time, it’s better to have higher session lengths, as a person that is actively using your app is more inclined to buy and convert into a subscriber or client. Yet, session lengths and how this metric can be used to make decisions are different depending on the app and the time of day. Mobile games can have long sessions throughout the entire day, while a taxi app has longer session lengths in the morning or at night when people travel long distances. Session length = the time spent inside the app during 1 session
Time in-app
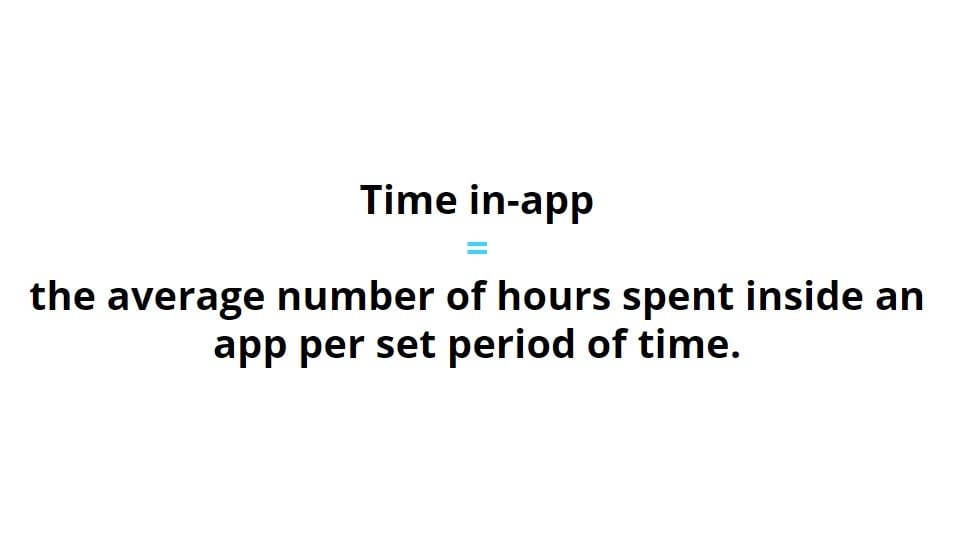
The time in-app metric measures the hours (or minutes) a user spends inside your app per day, week or month, depending on the app type. It’s pretty straightforward, the more time people spend inside an app, the higher the chances of generating revenue through ads or in-app sales. If your time in-app is decreasing it may be that users either get bored quickly or that the app no longer helps them as much as in the past. Constantly updating your app and adding new content and functionalities is the best way to keep users inside and engaged. Time in-app = the average number of hours spent inside an app per set period of time.
Retention rate
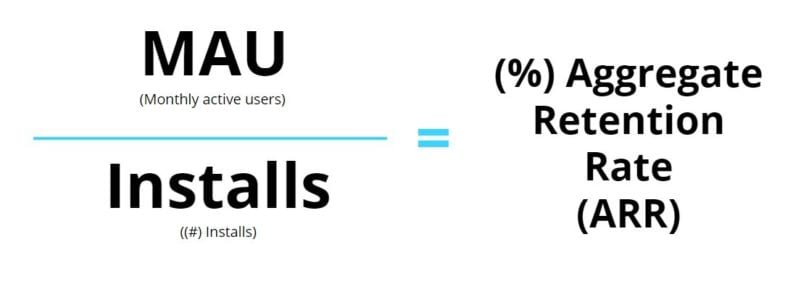
The retention rate is one of the most important app store optimization factors to take into consideration. It is the percentage of active users (people who use your app continuously) over a given period of time. It’s the exact opposite of the churn rate (percentage of users that leave the app in a given period of time). App retention rates can also be used in data comparison. By doing this, you can compare users that were brought through different marketing campaigns or from different periods, gaining valuable insight into your marketing efforts. In terms of app retention rates, you can calculate it in 2 standard ways. Aggregate Retention Rate (ARR) is the total number of monthly active users (MAU) divided by the total number of installs in that period. MAU / #installs = % ARR
Aggregate App Retention Rate
Of course, there are many other app engagement metrics that a company can track. From how fast users complete a level to how the users move through the app’s interface. Yet, these are really specific metrics that each company must decide on based on their app, goals, and strategies. If you want some insight or help to define your app engagement metrics, talking to an ASO agency may help.
App Event Tracking
This metric could potentially be placed both in the engagement category and in the performance one. Depending on what users need to do inside an app or what flow should be followed, a company can decide on certain events that should be tracked. For example, game developers track how fast users complete certain levels. By correlating that information with the moment a user churns, they can analyze if people leave the game because a level was too hard for them and decide to make the level easier. You can also track when users are more likely to review your app or share your content, allowing you to optimize your social marketing campaigns or ASO efforts. This is not a metric that we can give a formula for. You need to think about what your app does and how users interact with it. Just make sure you don’t start tracking EVERYTHING because you’ll get lost in the data.
Mobile App Performance Metrics
After we’ve talked about how to measure user engagements, it’s also important to mention performance. What makes money and what loses money Without a good understanding of how performance metrics affect your profitability, it’s really hard for an app to become sustainable and generate revenue.
Cost Per Acquisition (CPA)
Let’s start with one of the most important – Cost per acquisition or CPA. This metric shows the amount of money spent in marketing campaigns for each conversion. Just to be clear, CPA is usually not the same as CPI (cost per install). As you can track multiple goals as a CPA, and an install is just one of those goals. Yet, considering that we are talking about apps here, let’s assume that the main acquisition here is indeed the installation of the app. And all marketing efforts are around that one goal. So, the CPA (or CPI in this case) can be calculated by dividing all of the marketing costs in a certain period of time by the number of app installations in the same period. = costs / # of acquisitions or conversion you’re tracking 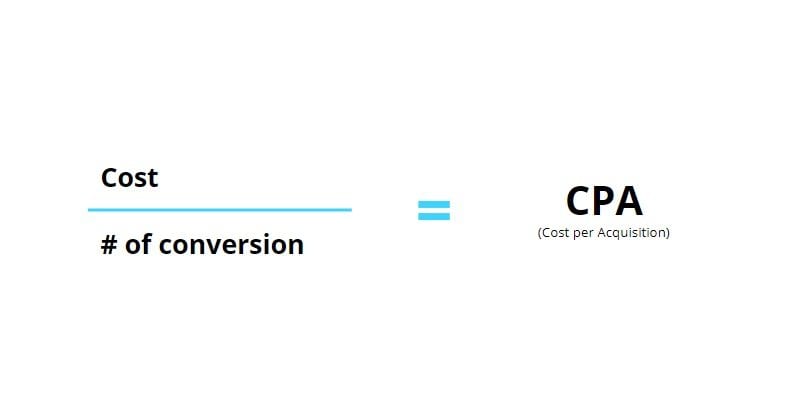
Again, Retention and Churn Rates
While we mentioned Retention Rate earlier in this article, we did not mention Churn rate. The churn is the opposite of retention and shows how fast users uninstall your app. A high churn rate is bad for business. You’re practically spending money to bring people that uninstall quickly and don’t bring any revenue. We’re mentioning the churn rate here because the first way to reduce it is to stop bringing bad users. Optimize your campaigns and be more specific. Your marketing goals should be to bring people that convert, not just bring people for the numbers. Also, by remarketing and using lookalike audiences based on people that spent money inside of the app, you have a higher chance of reducing the churn rate.
Lifetime Value (LTV)
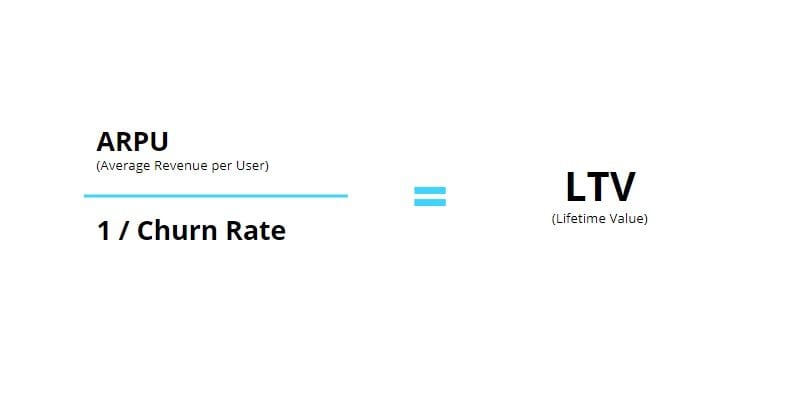
As mentioned earlier, Lifetime Value is a metric that when correlated with the CPA can help you understand if you’re paying too much for your users, if you need to boost your budgets or if you should simply stop running a campaign. You need to always make sure that the LTV is higher than the CPA and that the difference is high enough to cover your costs and make a profit. Lifetime Value is always used to predict the potential earnings of a campaign. If you know that spending $10,000 gets you X amount of users and that each user brings Y dollars, you can then decide if it’s worthwhile for you to spend the money or not. It’s important to take many data sources into consideration: :
- Average order value
- The average number of transactions per user
- How fast the first transaction takes place
- How fast users churn
Average Revenue Per User (ARPU) + Average Revenue Per Paying User (ARPPU)
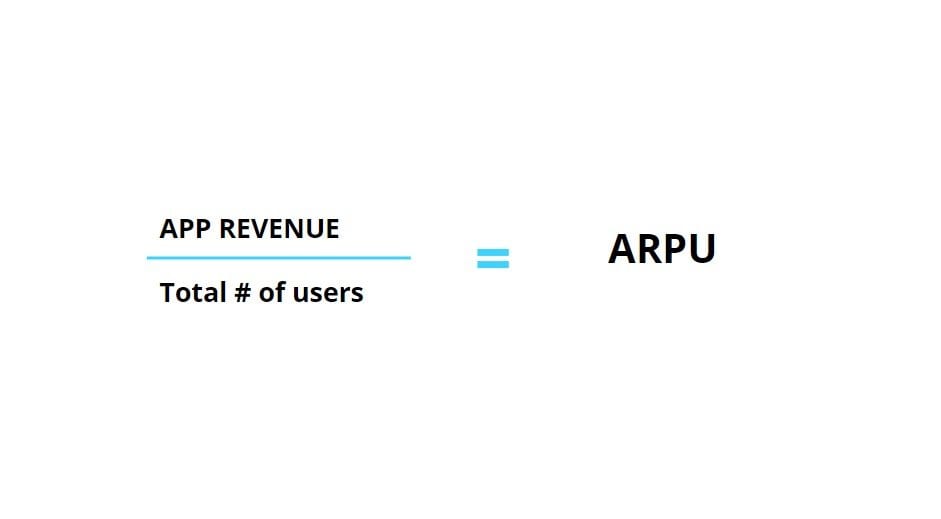
Earlier we used ARPU in discovering the lifetime Value of a user. The average revenue per user is a simple metric to understand and calculate. Simply divide the total revenue of the app from launch by the number of users you’ve had. Example: App got 300,000 users since launch and had $1,000,000 in revenue. Because of this, the ARPU for the app is $3.3/user. The ARPPU is somewhat similar, yet, it only takes the paying users into consideration Example: If the same app had 100,000 paying users, the ARPPU is $10/paying user.
Return On Investment (ROI)
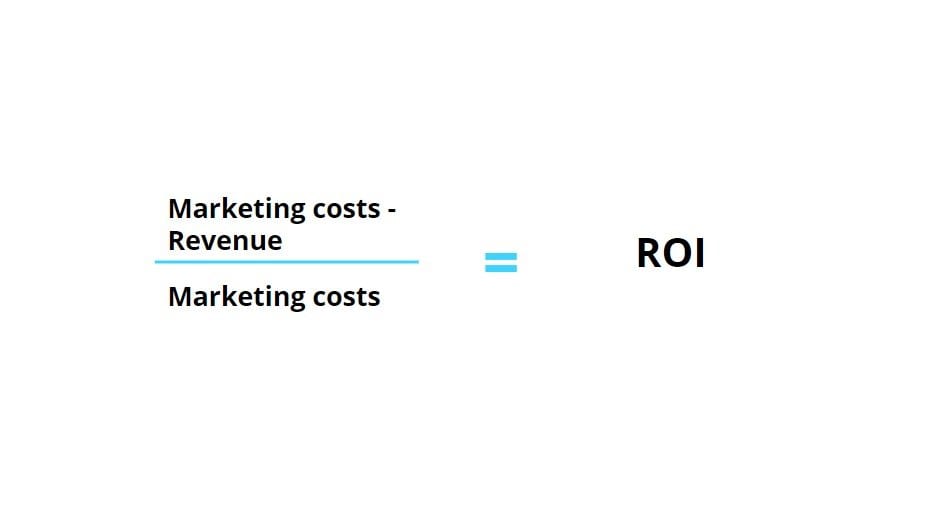
Ah, the three words that every investor loves to hear. How much do I pay and how much do I get back? The ROI is the main decision factor for an investor or CEO. The ROI is extremely useful when doing paid marketing campaigns for your app. By understanding which marketing campaigns bring the best ROI, you’ll know if you need to shift budgets or increase them. Take a Facebook Ad campaign for example. You have 10 variants for the campaign. It’s wise to A/B test them in order to better understand which ones are working best. By doing this, you may realize that some of your ads may not be bringing in any profit, in which case it’s smart to scrape them and relocate them to better-performing ads to reduce losses and increase revenue.
How to improve your app metrics?
Eliminate Friction
Friction points in the mobile app experience are moments of disconnect, moments where you are most vulnerable to users changing course. A classic example of a friction point would be a login wall. You’ve done the hard work to get the user to the app listing page in the app store, and convinced them to install your app. The first screen they see is a social login screen. Uncertain and unsure, the user backs away, closing your app and uninstalling it, never to return. These friction points happen throughout the process, from discoverability to usage. Identifying these points is key to improving your most important metrics.
Identifying the Points
A recent study by Facebook distilled the friction points into three critical phases: discovery, install and post-install. At the discovery phase, the most common friction points are:
- Irrelevant ads or offers
- Poor quality/look and feel of an ad
- Not being able to skip an ad
- The ad leads to the wrong page
- Unclear ad message about the function of the app
For the install phase, common friction pitfalls include:
- Realizing that the app is not free
- Unclear/Lack of description of the app
- Uninteresting app content
- Bad reviews
- No free trial
- Requests to access too much information from the mobile device
- Requests to publish posts on social media
- The download takes too long
- Requests to access friend list via social media
- The app is too big/too expensive to download
Finally, in the post-install phase, the common friction points that should be addressed are: Privacy and security concerns
- Difficulty understanding the app’s functionality
- Registration/form-filling
- Too many crashes and glitches
- Expensive in-app purchases
- Too many in-app ads
- Payment system did not seem secure
- Currency shown is not in local currency
Actionable Takeaways
The Facebook report gives some solid takeaways for mobile app developers: Get the content and creative right for your ads. Set the expectations right from the start, especially when it comes to ads. This minimizes friction points down the line. Take it slow Keep initial download size small, and make the rest of the app available through post-install updates. The goal is not to shock users and create a friction point, but to do things gradually. Similarly, enable social functionality but make it available as an opt-in, and not as one of the first screens a user sees. Facilitate payments Make the payment process as easy as possible for users. The more popular payment options you offer, especially when localizing your app, the better. Stand Out To Get Ahead A common theme in the report is the need to stand out. There are millions of apps out there, and you have to give users a compelling reason why they should choose yours – and stick with it. Want to see huge improvements across key metrics such as downloads and retention rates? Extensive experience and expertise are needed, and we can help.


